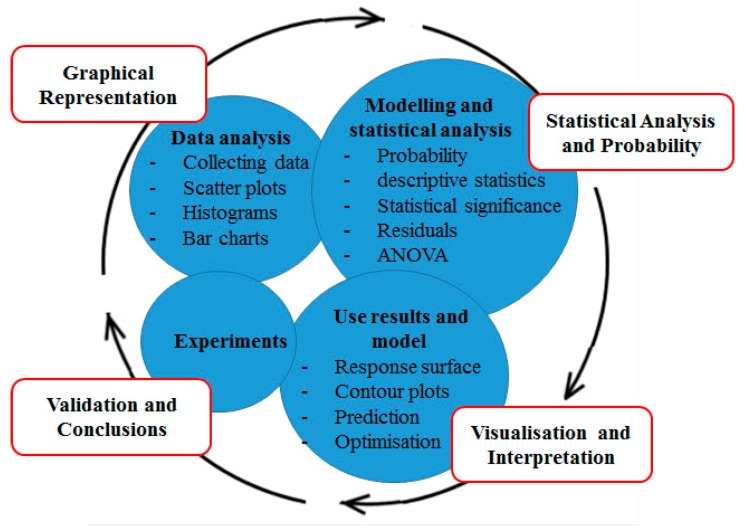
Figure 5.
A typical DoE analysis route from initial Experiments to validation and conclusions. The rationale for data analysis is to evaluate the effects of variables on response. Graphical Representation shows how the data are distributed. The Statistical Analysis and Probability stage identifies variables that are statistically significant. This will identify variables that are important to bring forward to the subsequent optimisation step based on their statistical significance. The Visualization and Interpretation stage will focus on representational analysis that identifies optimal levels.

