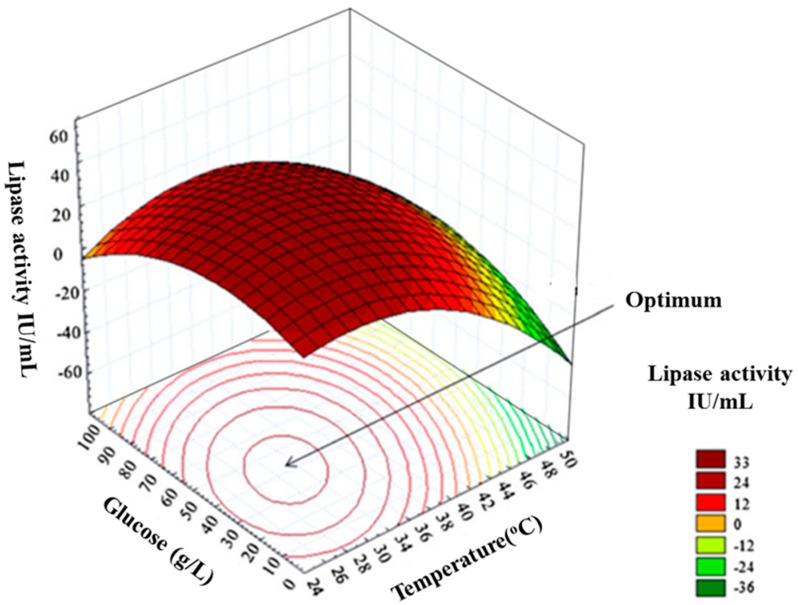
Figure 7.
An example of response surface and contour plot adapted from Nelofer et al., 2012 [163]. The figure depicts the two-factor interaction (in this case the two factors explored are glucose and culturing temperature) where one factor influences the response of another factor. It also shows the visualisation of optimum levels. The colour scale indicates the level of lipase activity (IU/mL) where red indicates the region of optimal yield, yellow indicates medium yield, and green indicates low yield. In this case, the optimal enzyme activity (33 IU/mL) was achieved at a culture temperature between 30 °C and 34 °C; and a glucose concentration between 40 g/mL–50 g/mL. Image used with permission.

