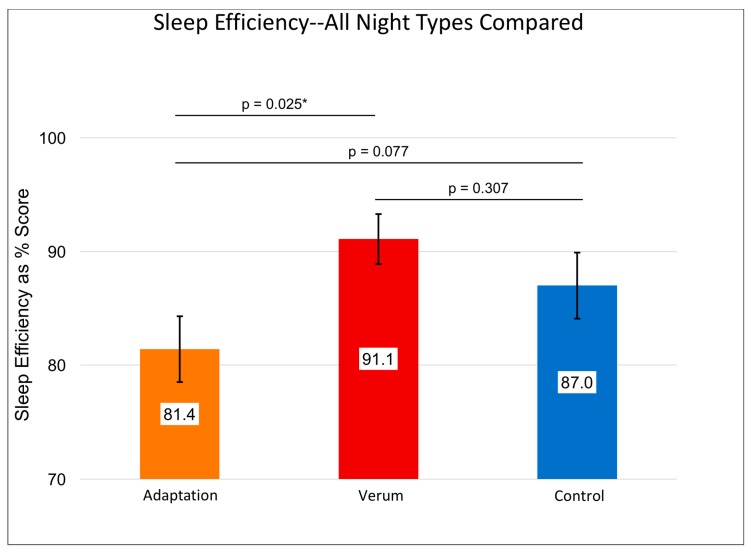
Figure 2.
Shows the repeated measures effects adaptation night 1 (orange) and verum (red bar) vs. control (blue bar) stimulation collapsed across nights 2 and 3 on sleep efficiency, n = 14. Results of individual, uncorrected t-tests are shown at the top. An asterisk “*” indicates a significant difference (p < 0.05). The omnibus within-subjects’ F was significant at p = 0.038. Error bars represent +/- 1 standard error of the mean. Sleep efficiency variables only exist for nights of in-laboratory sleep, so no “Pre-Lab Sleep” measure could be obtained. Sleep efficiency for verum night was significantly greater than that for the adaptation night.

