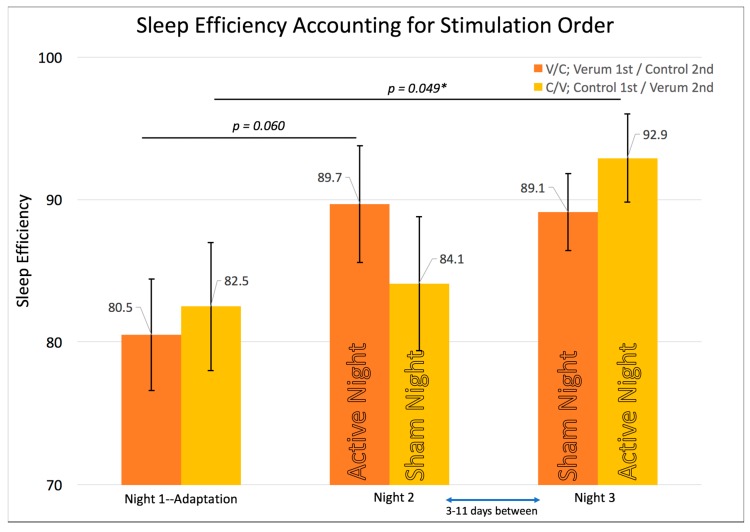
Figure 4.
Shows the repeated measures effects of sleep efficiency while accounting for the counterbalancing of stimulation condition order. Error bars represent +/- 1 standard error of the mean. Results of individual, uncorrected t-tests are shown at the top. An asterisk “*” indicates a significant difference (p < 0.05). The omnibus multivariate F was significant at p = 0.044. The within-subjects’ F was significant at p = 0.049. Sleep efficiency shows the highest scores on each group’s verum night with a trend for the V/C group’s verum night vs. adaptation night and a significant effect for the Control/Verum C/V group’s verum night vs. adaptation night.

