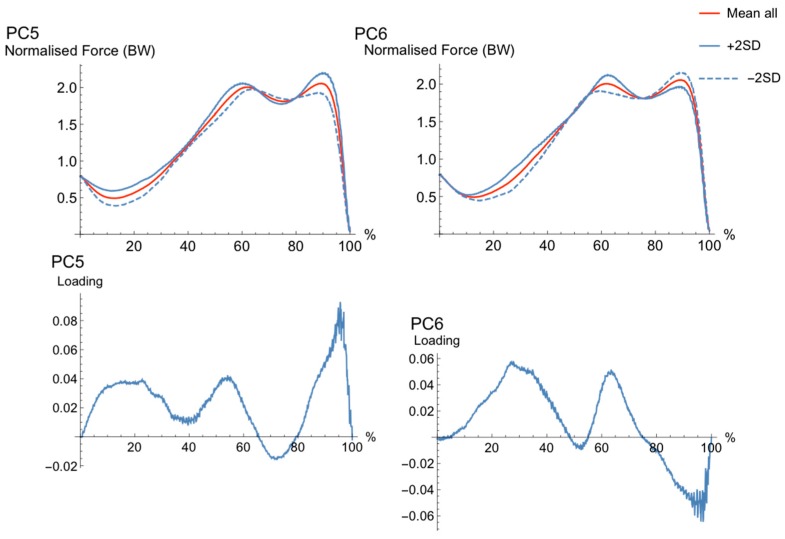
Figure 3.
The pattern of variance, or loading vector, for PC5 and PC6. Mean waveform (solid, red), bounded by single PC reconstructed waveforms that represent only the variance due to the PC of interest for +2SD (solid, blue) and −2SD (dashed, blue) for “extreme” subjects. The loading vector for each PC is shown in the figure directly below the reconstructed waveforms for each PC.

