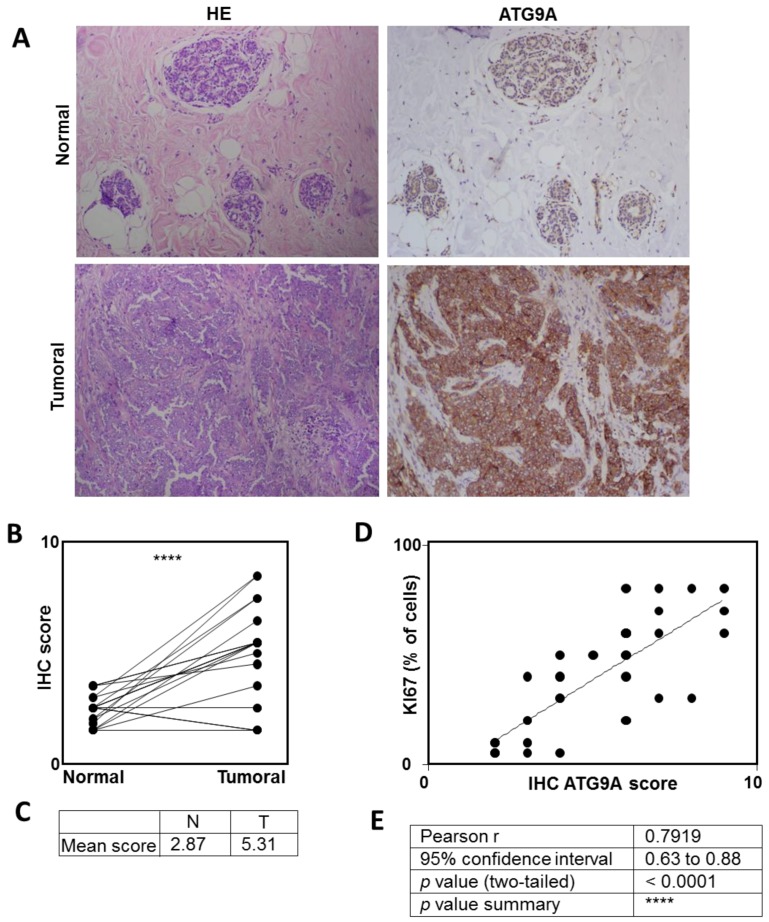
Figure 2.
ATG9A protein overexpression in triple negative breast cancer. Quantification of ATG9A protein levels using IHC in triple negative breast cancer (TNBC) biopsies compared to matched healthy adjacent tissues. (A) Representative images of ATG9A protein staining in tumor and healthy tissues (left: HE (hematoxylin & eosin) staining, right: ATG9A staining). (B,C) Quantification of ATG9A staining in 21 patients. (D) Correlation between ATG9A score with KI67 staining in tumors. (E) Quantification.

