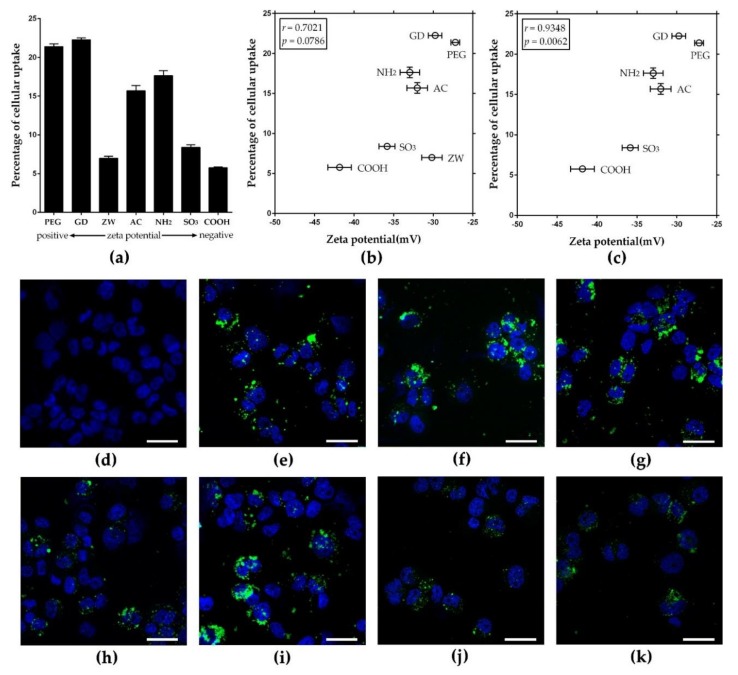
Figure 4.
Cellular uptake of F-PLNPs at 50 μg/mL by THP-1 macrophages. (a) The percentage of cellular uptake of F-PLNPs evaluated by fluorescence intensity. (b) Plotting the values of zeta potential in Roswell Park Memorial Institute medium (RPMI-1640) against percentages of cellular uptake, yielding a Pearson’s correlation coefficient of 0.7021. (c) Correlation plot upon excluding ZWF-PLNP of Figure 4b showed a much improved Pearson’s correlation coefficient (0.9348, p = 0.0062). Data are presented as means ± standard error of the mean (SEM); n = 4. Confocal laser scanning microscopy (CLSM) images of (d) vehicle control, (e) amine (NH2)F-PLNP, (f) guanidium (GD)F-PLNP, (g) polyethylene glycol (PEG)F-PLNP, (h) zwitterionic (ZW)F-PLNP, (i) acetyl (AC)F-PLNP, (j) carboxyl (COOH)F-PLNP, and (k) sulfonic (SO3)F-PLNP. Blue fluorescence, 4′,6-diamidino-2-phenylindole (DAPI) staining; green fluorescence, F-PLNPs. Scale bar: 30 μm.

