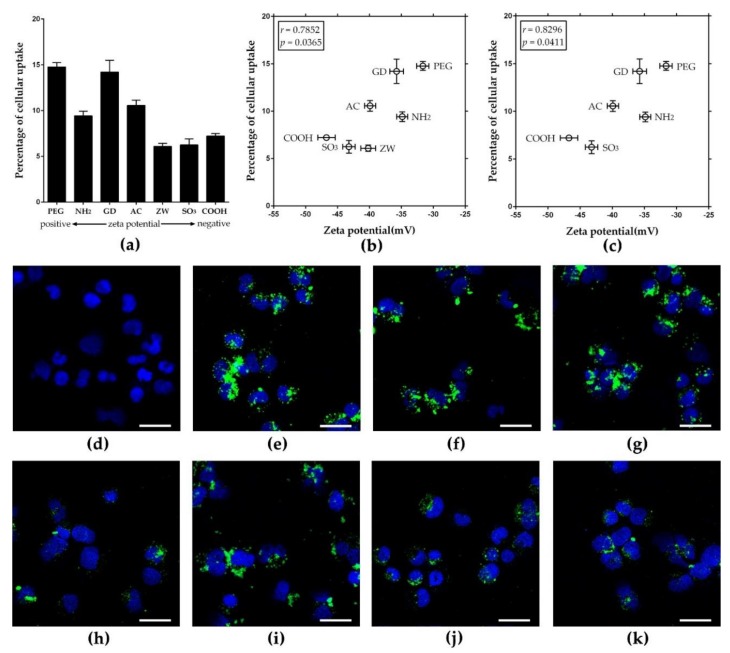
Figure 5.
Cellular uptake of F-PLNPs at 50 μg/mL by the non-phagocytic A549 cells. (a) The percentage of cellular uptake of F-PLNPs determined by fluorescence intensity. (b) Plotting the values of zeta potential in Dulbecco’s modified Eagle medium (DMEM) against percentages of cellular uptake, yielding the Pearson’s correlation coefficient of 0.7852. (c) Correlation plot upon excluding (ZW)F-PLNP of Figure 5b showed a much improved Pearson’s correlation coefficient (0.8296, p = 0.0411). Data are presented as means ± SEM; n = 4. CLSM images of (d) vehicle control, (e) amine (NH2)F-PLNP, (f) guanidium (GD)F-PLNP, (g) polyethylene glycol (PEG)F-PLNP, (h) zwitterionic (ZW)F-PLNP, (i) acetyl (AC)F-PLNP, (j) carboxyl (COOH)F-PLNP, and (k) sulfonic (SO3)F-PLNP. Blue fluorescence, DAPI staining; green fluorescence, F-PLNPs. Scale bar: 30 μm.

