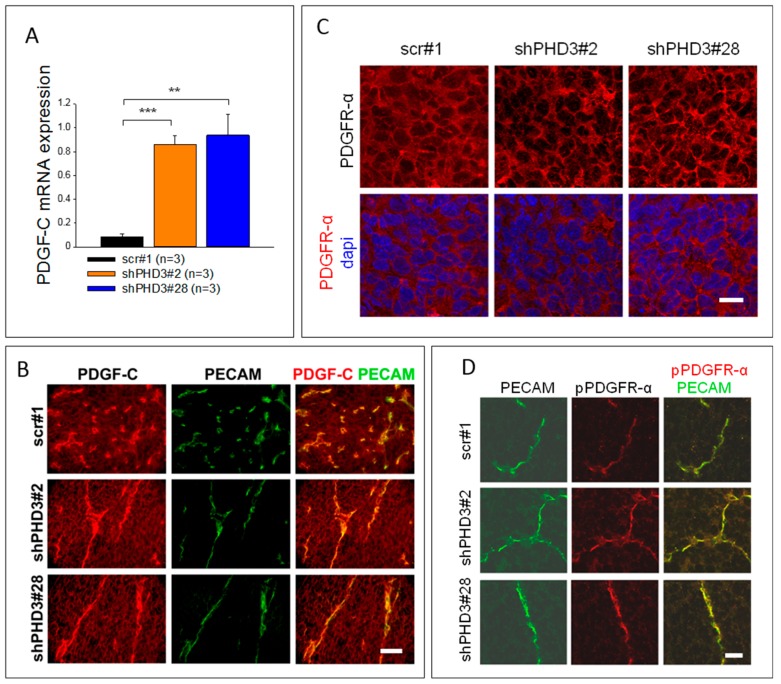
Figure 5.
The expression of PDGF-C is strongly increased in shPHD3 tumors. PDGFR-α is localized at the plasma membrane of all cells in control and shPHD3 tumors. (A) In order to determine the PDGF-C expression level in PHD3 silenced tumors, qRT-PCR analyses of whole tumor lysates were performed. The error bars represent mean values ± SEM. (** p < 0.01, *** p < 0.001). (B) Tumor sections were stained to detect PDGF-C and PECAM. Scale bar: 50 µm. (C) Detection of PDGFR-α positive cells on tumor sections. Scale bar: 20 µm. (D) Co-immunofluorescence staining for PECAM and phosphorylated PDGFR-α (pPDGFR-α; pTyr754) shows receptor activation in endothelial cells. Scale bar: 25 µm.

