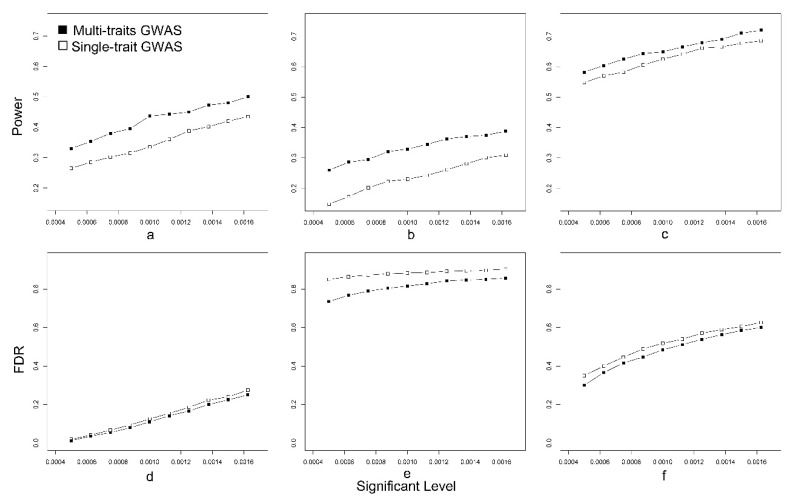
Figure 2.
Comparison of power and false discovery rate (FDR) between multiple-trait GWAS and single-trait GWAS. We simulated three situations including medium heritability (a,d), low heritability (b,e), and environmental correlation (c,f). (a–c) Power under different significant levels. (d–f) FDR under different significant levels.

