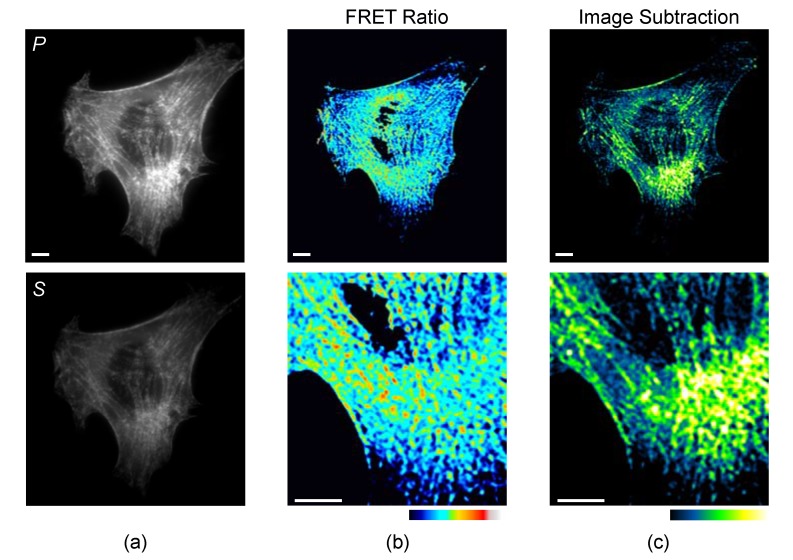
Figure 3.
Image analysis of an NIH3T3 fibroblast expressing the mCerulean3 myosin II biosensor [45]. (a) P and S images were collected using widefield polarization microscopy; (b) the images can be ratioed (P/S) using a conventional processing strategy. Bottom shows an enlarged area of the lower perinuclear region; (c) alternatively, a scaled S image can be subtracted from the P image to preserve differences in sensor localization that are obscured by the intensity-independent image ratio method. Scale bars are 5 μm.

