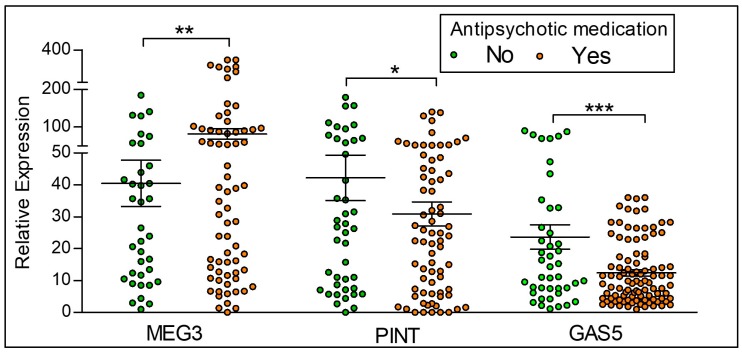
Figure 4.
LncRNA expression between controls and participants on antipsychotic medication. Yes = Participants with the diagnosis of psychosis and currently on antipsychotic medication, No = Control participants who are not on antipsychotic medication. MEG3 is significantly higher, and PINT and GAS5 lower in those taking antipsychotic medication when compared to those not currently on antipsychotics. Statistical significance is determined by t-test (* p < 0.05; ** p < 0.01; *** p < 0.001; ns, not significant). The figures represent Mean ± SEM for the relative expression of lncRNAs. SEM: Standard Error of Mean.

