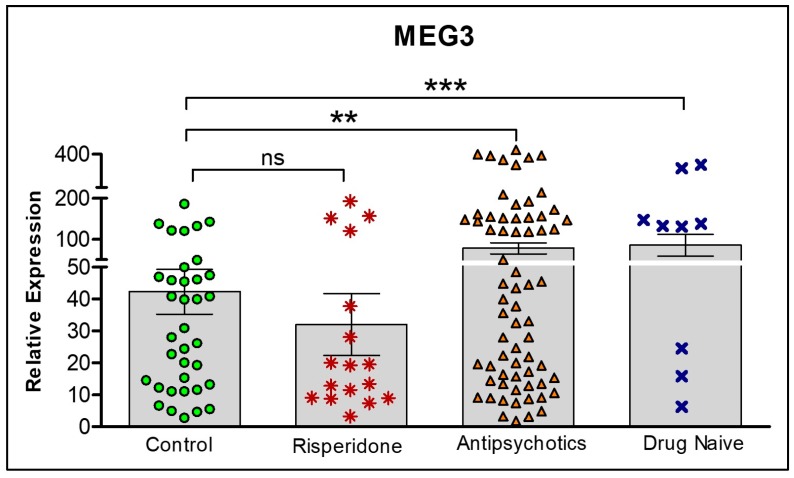
Figure 7.
Comparison of lncRNA MEG3 expression levels from four treatment conditions: controls, risperidone only, currently on any other antipsychotic, and drug naïve. Statistical significance is determined by t-test (** p < 0.01; *** p < 0.001; ns, not significant). The figures represent Mean ± SEM for the relative expression of lncRNAs. SEM: Standard Error of Mean.

