Figure 2.
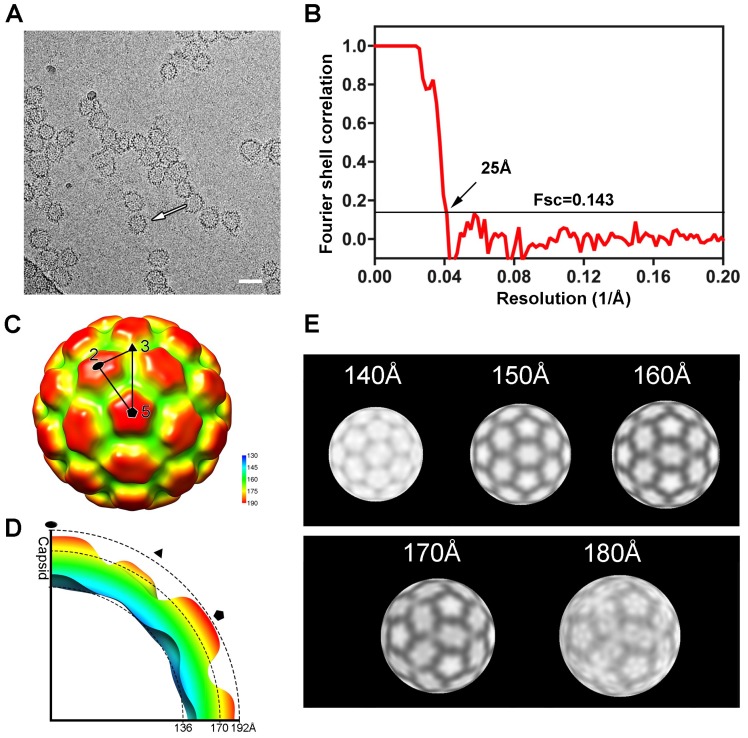
Cryo-electron micrography (Cryo-EM) and three-dimensional reconstruction of the CA N21C/A22C particle. (A) A representative cryo-electron micrograph of the CA N21C/A22C particle (white arrow). Scalebar is 50 nm. (B) Gold-standard Fourier Shell Correlation (FSC) curve for reconstruction of the N21C/A22C particle. (C) Surface rendering colored radially (blue to red) of the CA N21C/A22C cryo-EM density map viewed along a five-fold axis. The two-, three- and five-fold symmetry axes are indicated by the black ellipse, triangle and pentagon, respectively. An asymmetric unit (indicated by the big triangle) contains four CA subunits: One from a pentamer and three from a hexamer. (D) Density section of the N21C/A22C indicated in black dash lines with symmetry axes labeled. The inner and outer radii of capsid are 136 Å and 192 Å respectively, along the 2-fold axis. (E) Different radial projections of the map at the different radii (140 Å to 180 Å). The three hexamers show interactions in the range of 160Å to 180Å.

