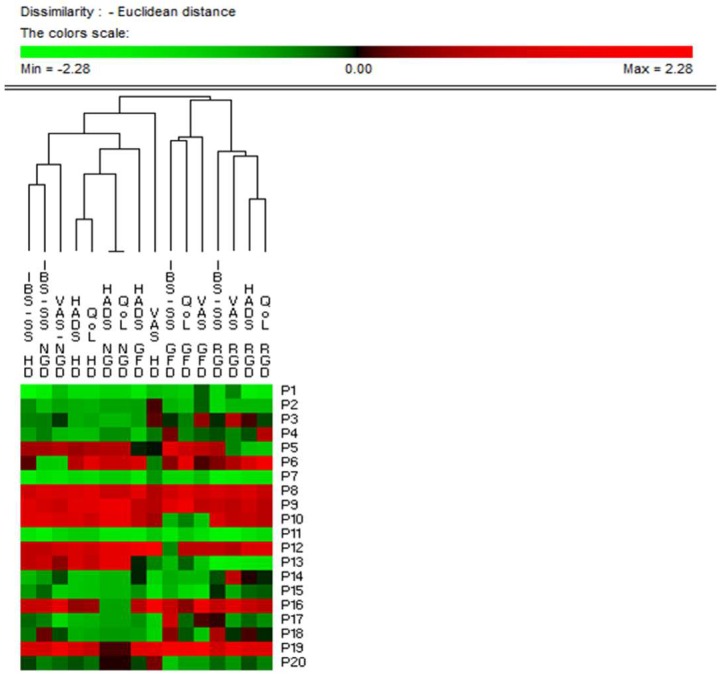
Figure 4.
Permutation analysis based on clinical scores. Euclidean distance and McQuitty’s criterion were used for clustering. Cases (patients) were numbered from P1 to P20. Variables were reported as abbreviation of clinical scores (IBS-SS, Irritable Bowel Syndrome Severity Score; VAS, Visual Analogue Scale; HADS, Hospital Anxiety and Depression Scale; QoL, Quality of Life) plus the type of diet (HD, Habitual Diet; GFD, Run-in Open gluten-free diet; RGD, Reduced-gluten diet; NGD, Normal-gluten diet). Colours correspond to normalized mean data levels from low (green) to high (red).

