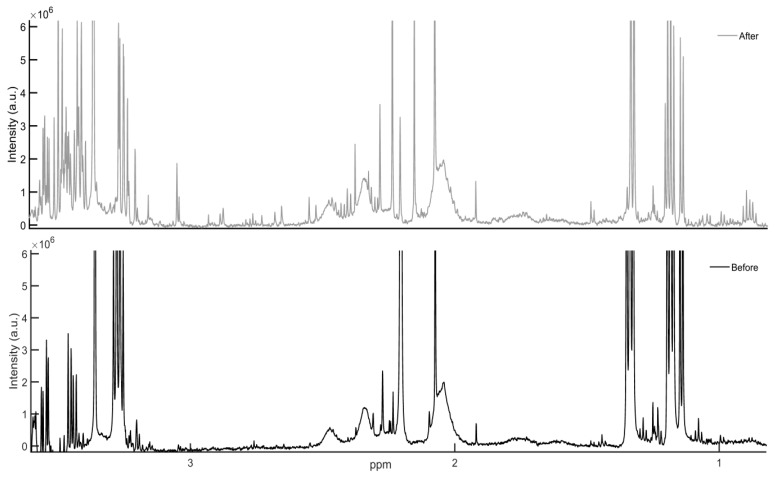
Figure 2.
600 MHz 1H-NMR CPMG spectra of metabolic intensities in one patient’s bronchoalveolar lavage fluid obtained before (black) and after CPB (grey). The position of a signal is a characteristic of a given compound, while the area under the signal is proportional to the compound’s concentration. An increased number is observed in the signals of sample collected after CPB.

