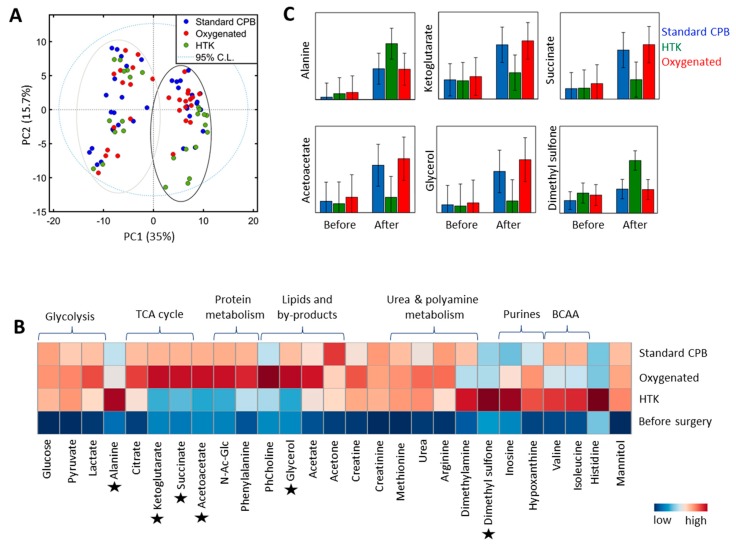
Figure 3.
Lung metabolic profiles. (A) Principal component analysis (PCA) before (−PC1 axis) and after CPB (+PC1 axis) colored by the treatment received (standard CPB, blue; oxygenated blood, red; HTK, green). (B) Averaged heat-map representation of samples collected before (bottom raw) and after CPB (second to forth raw). Data are normalized to total intensity and auto-scaled, colored coded according to the levels of metabolites identified at a particularly time point and group; e.g., blue represent lower concentrations of metabolites, while red represents metabolites in which concentration increased post-CPB. Six metabolites presenting different trends across the groups are marked (*) and further displayed in (C) with mean and 95% confidence intervals. TCA: tricarboxylic cycle acid; BCCA: branch chain amino acid.

