
Figure 4.
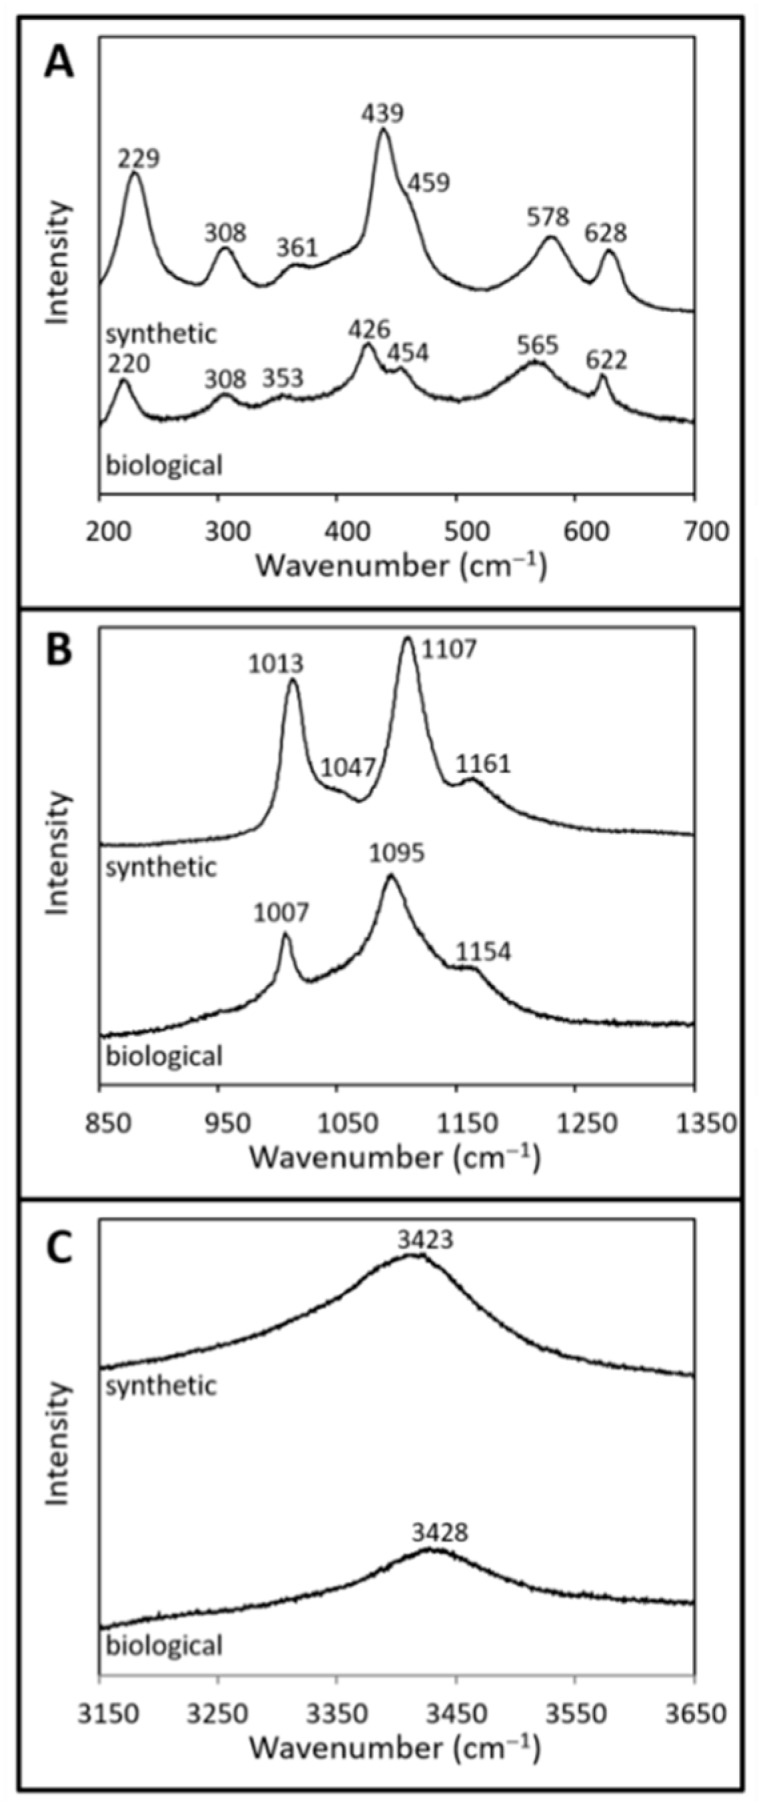
Raman spectra of synthetic and biological jarosite. Raman spectra from (A) 200 to 700 cm−1, (B) 850 to 1350 cm−1, and (C) 3150 to 3650 cm−1 of synthetic jarosite and biological jarosite. The spectral plots are of normalized intensity (arbitrary values) versus wavenumber with a spectral precision of ±2 cm−1. Spectra are stacked in order to facilitate comparisons. Peak positions and assignments are listed in Table 1.