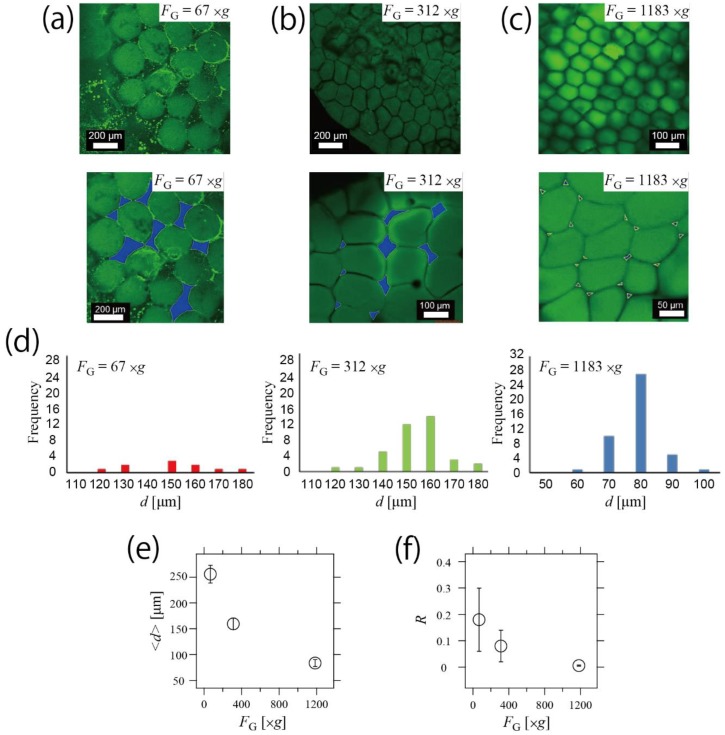
Figure 3.
Control of the structures of the microhydrogel in the network by changing FG. (a–c) CLSM images of the honeycomb microhydrogel network fabricated under various values of FG. The applied FG was 67× g (a), 312× g (b), and 1183× g (c). Lower images are magnified images. Sgap corresponds to the blue area in the lower images. It was speculated that the green puncta in the image of FG = 67× g (a) were the emulsions of exuded fluorescein sodium salt solution from the microhydrogel. (d) Histograms of <d> of each FG. (e) Control of <d> by changing FG. <d> was decreased by increasing FG. (f) Control of R by changing FG. R was decreased by increasing FG.

