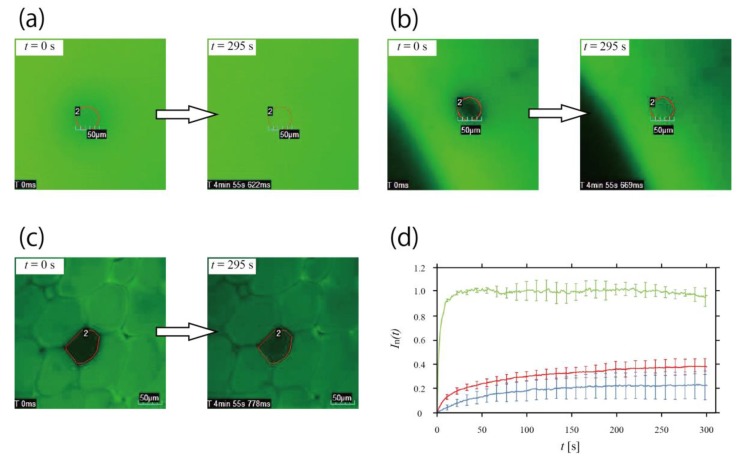
Figure 4.
FRAP analysis in the honeycomb microhydrogel network. (a–c) Frames of the movie of the fluorescence recovery. FRAP analysis was performed in (a) the non-gel aqueous solution, (b) the non-compartmentalized bulky hydrogel, and (c) the honeycomb microhydrogel network fabricated under FG = 1183× g, and the fluorescence recovering was observed for 5 min. The area enclosed by the red line is the photobleaching area. The numbers near each area were for analysis. (d) Time course of In(t). In(t) of the honeycomb microhydrogel network (blue curve) had a longer recovery time than that of the non-gel aqueous solution (green curve) and the non-compartmentalized bulky hydrogel (red curve).

