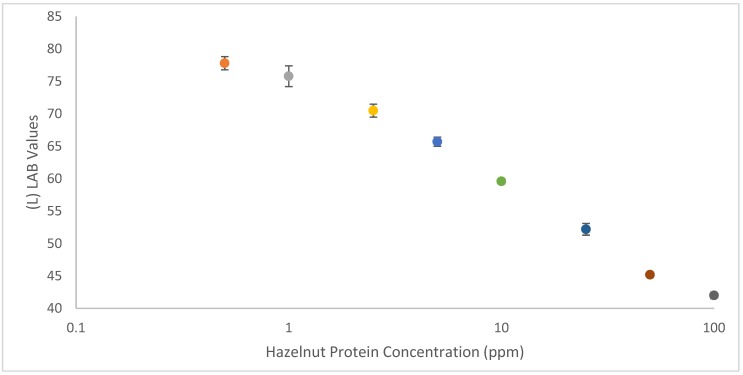
Figure 5.
A calibration curve showing the relationship between (L)LAB values of test lines of hazelnut LFIA in a decreasing concentration of hazelnut protein (in blank cookie). Error bars have been included to show the standard deviation across multiple (n = 3) measurements. An (L)LAB value of 100, (0, 0) corresponds to a true white and of 0 (0,0) to a true black, in this study the lowest L value was 42 and so the L (LAB) axis begins at 40.

