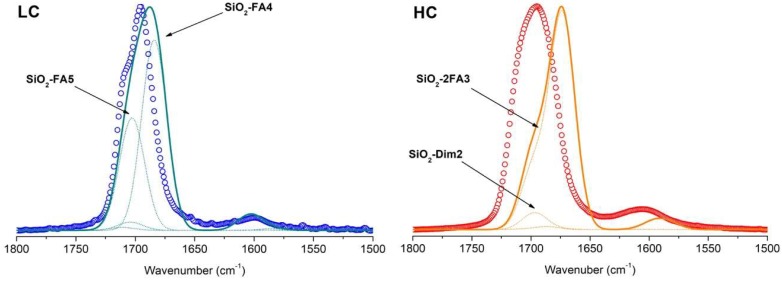
Figure 6.
Reference experimental spectra at low coverage (LC, empty blue dots) and high coverage (HC, empty red dots) compared to the simulated ones (solid cyan and orange lines for LC and HC respectively). Simulated spectra were reconstructed from the computed vibrational frequencies (spectral profiles described by Gaussian functions with full width at half maximum (FWHM) of 20 cm−1) for each LC/HC adduct weighted over the corresponding Boltzmann population. The single simulated spectral components (i.e., each belonging to a single adduct model) are reported as dotted lines for both LC and HC (nil components are omitted for clarity).

