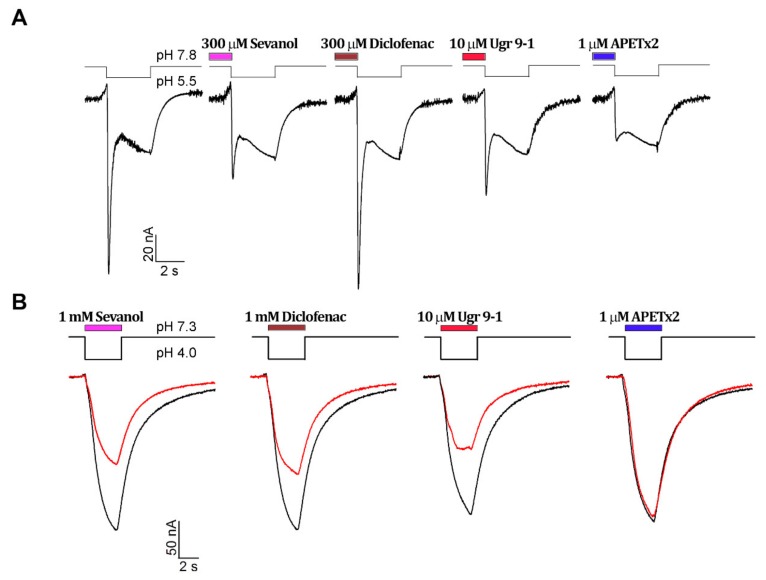
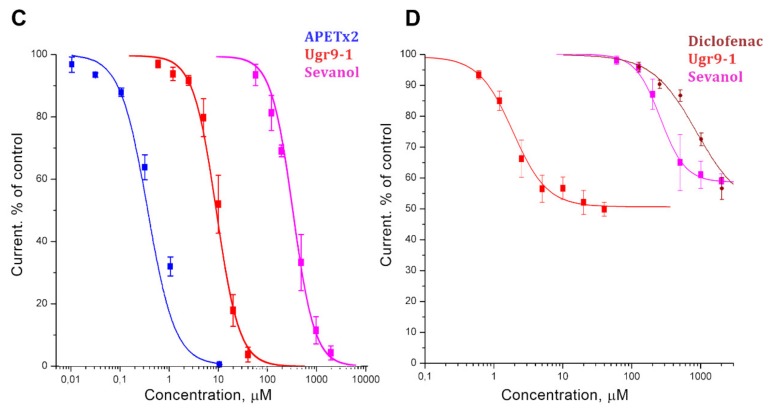
Figure 1.
Comparison of ligands’ antagonistic effects on hASIC3 channels. Whole-cell currents were induced by pH drops and recorded at the holding potential −50 mV. (A) Effect of ligands on the transient component of current at conditioning pH 7.8. The control trace is shown first; (B) Effect of ligands on the sustained component at conditioning pH 7.3. The black line is the control trace, and the red line is the trace of activation in the presence of a ligand. Dose-response curves for transient (C) and sustained (D) currents’ inhibitions are shown. Data are shown as mean ± SEM (n = 4–6) and fitted with the logistic equation (solid lines).


