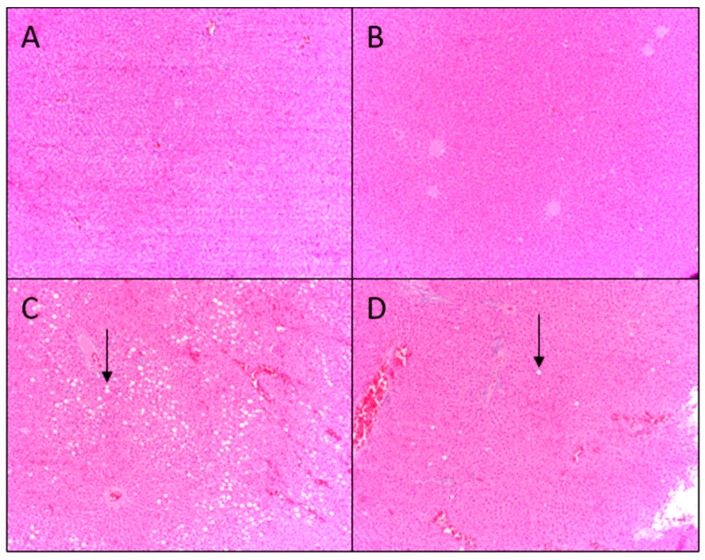
Figure 3.
Representative histological staining images of livers of growing female rats consuming (A) AIN, (B) AIN/AP, (C) Western, or (D) Western/AP following eight weeks of feeding. Arrow indicates fat deposition. Scores analyzed by chi-square test at p < 0.05.
Histological steatosis scores for diet groups.
| Measurement | AIN | AIN/AP | Western | Western/AP | p-Value |
|---|---|---|---|---|---|
| Steatosis Grade | <0.0001 | ||||
| 0 | 6 | 4 | - | - | |
| 1 | 1 | 3 | 6 | 7 | |
| 2 | - | - | 2 | 1 | |
| 3 | - | - | - | - |

