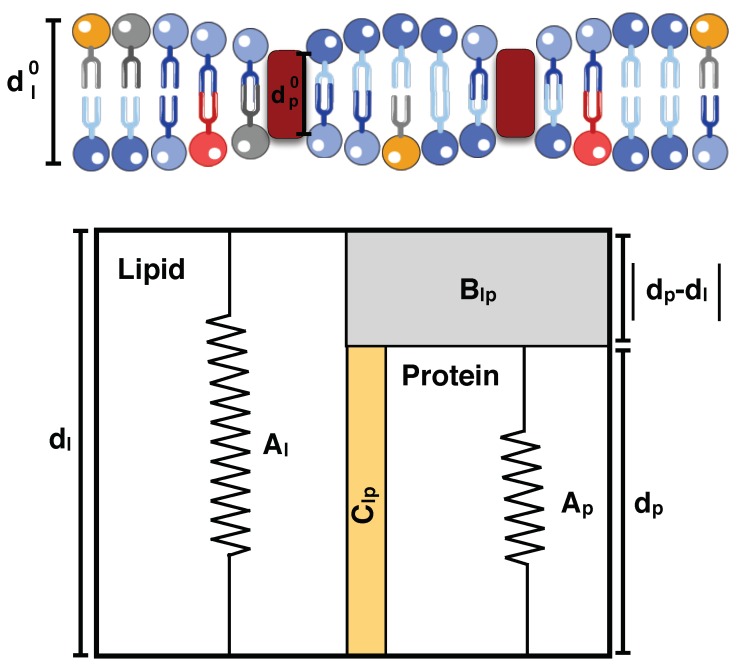
Figure 4.
Mattress model representation of the hydrophobic mismatch phenomena [208]. Both protein and lipid bilayer are modeled as one-dimensional springs with constants and , respectively. and are the initial lengths, and and are the final lengths of the lipid bilayer and the protein after deformation, respectively. The gray area corresponds to the hydrophilic region with the strength of , and the yellow region indicates the adhesive region with adhesive interactions strength of .

