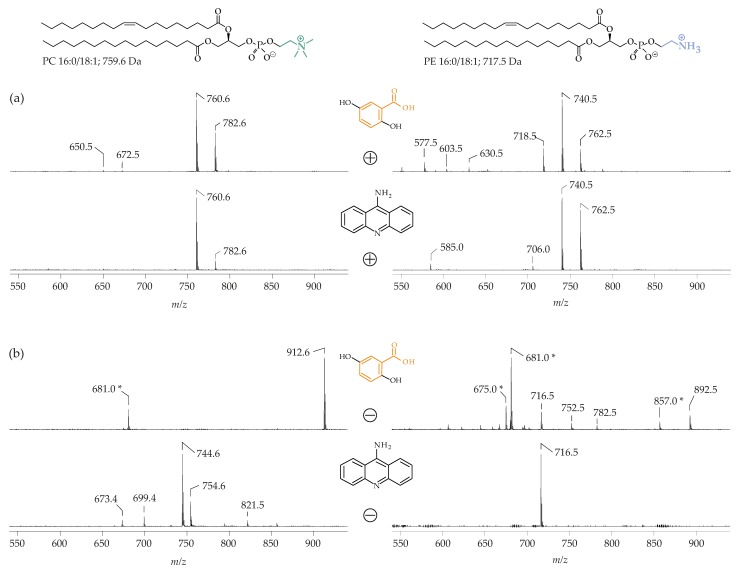
Figure 4.
(a) Positive ion MALDI-TOF mass spectra of 1-palmitoyl-2-oleoyl-sn-phosphatidylcholine (PC 16:0/18:1; M = 759.6 g/mol, (left)) and 1-palmitoyl-2-oleoyl-sn-phosphatidylethanolamine (PE 16:0/18:1; M = 717.5 g/mol; (right)); (b) Negative ion MALDI-TOF mass spectra of PC 16:0/18:1 (left) and PE 16:0/18:1 (right). In all cases, the samples (0.2 mg/mL) were diluted 1:1 (v/v) either with a 2,5-dihydroxybenzoic acid (DHB; 0.5 M in methanol) or 9-aminoacridine (9-AA; 10 mg/mL in isopropanol/acetonitrile; 6/4, v/v). All peaks are marked according to their m/z ratio. DHB matrix peaks are marked with asterisks. This figure was reprinted with permission from [96] and slightly modified.

