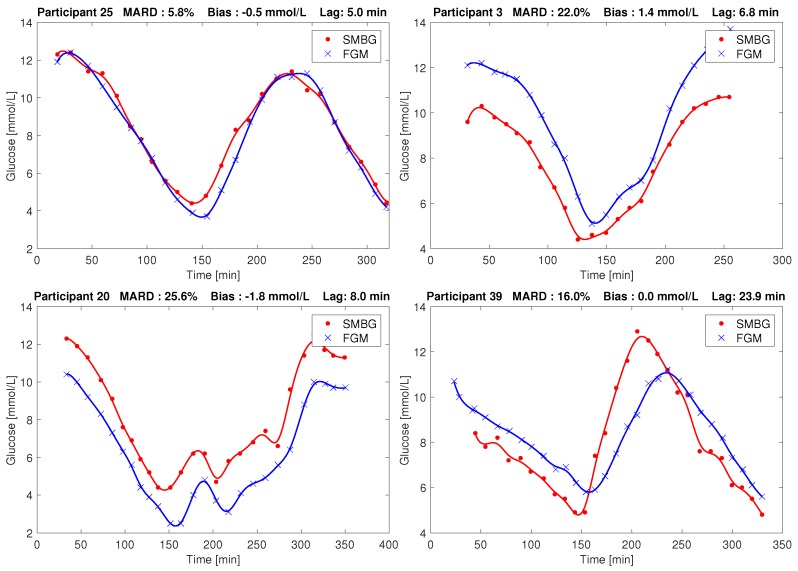
Figure 1.
Examples of Flash Glucose Monitor (FGM) and Self Monitoring of Blood Glucose (SMBG) recordings in our study. Top left: Low Mean Absolute Relative Difference (MARD). Top right: Large positive bias. Bottom left: Large negative bias. Bottom right: Large lag. Points are measurements, and the line between points is the result of smoothing, as described by Staal et al. [12].

