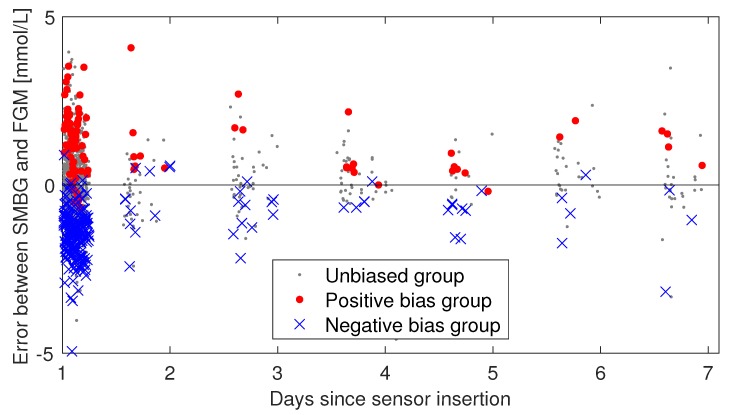
Figure 6.
Persistence of bias in days 2–7. The individual sensor errors (SMBG–FGM) are plotted against time and colored according to what bias group the participant was in at day 1. If the bias observed in day 1 is not persistent, one would expect the blue and red data points to start mixing as time progresses. The day 1 session is included in this plot, but the analysis of bias persistence considered data from days 2–7 separately from day 1 data.

