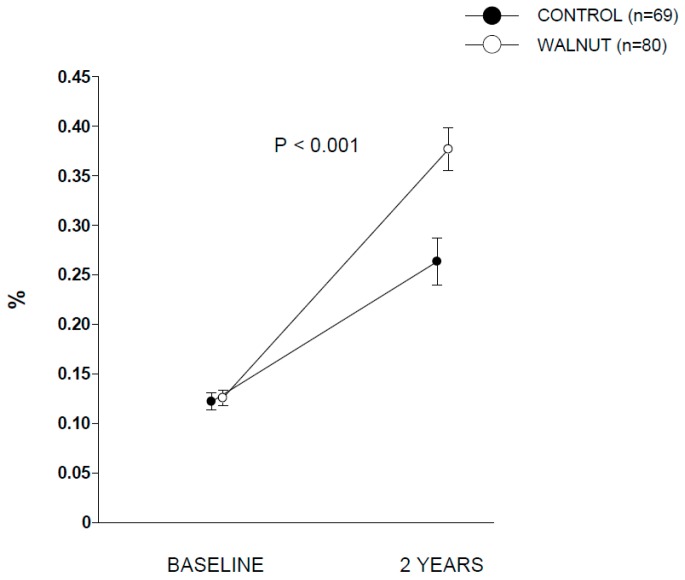
Figure 1.
Changes in alpha-linolenic acid (expressed as percentage of total fatty acids) in red blood cells after 2 years of intervention. p refers to interaction between time (baseline vs. 2 years) and intervention (control vs. walnut), obtained by two-way repeated measures ANCOVA. Baseline means (95% confidence interval) are 0.122 (0.113 to 0.131) and 0.126 (0.118 to 0.134) for control and walnut group, respectively. Means (95% confidence interval) at the end of intervention were 0.263 (0.240 to 0.287) and 0.377 (0.355 to 0.399) for control and walnut group, respectively.

