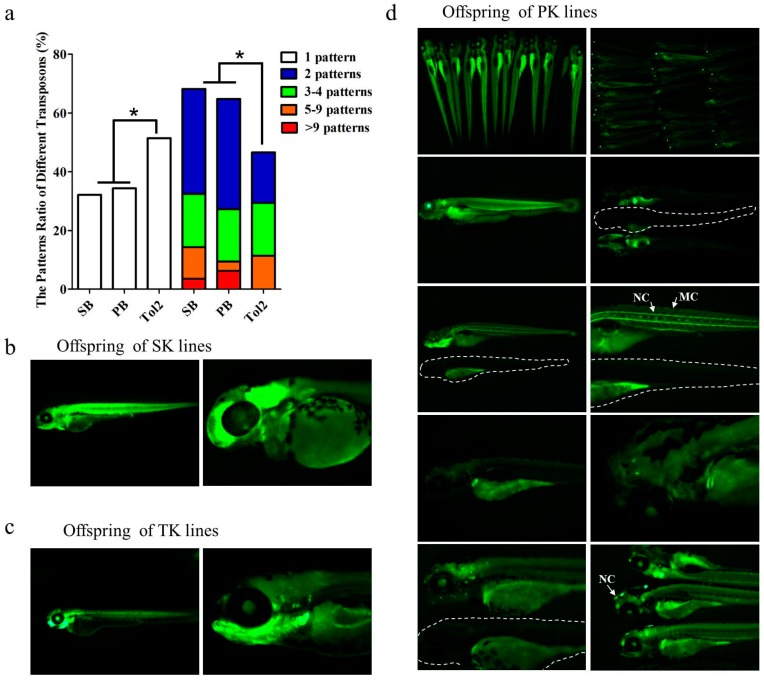
Figure 2.
ET pattern difference based on SB, PB and Tol2 transposons in zebrafish. (a) Pattern difference was measured by counting the different patterns of offspring at five days postfertilization (dpf) from each single founder. Significant difference was detected using a χ-squared test; asterisk indicates p < 0.05; (b–d) Offspring patterns of lines generated by SK (ET lines generated by the SB transposon), TK (ET lines generated by the Tol2 transposon), and PK (ET lines generated by the PB transposon). In various expression patterns, specific expression in tissues such as eyes, kidney tubes, muscles, and swim bladders could be detected, as well as specific expression patterns in various cells such as nerve cells (NC) and muscle cells (MC). White dotted lines in (d) indicate the WT fish.

