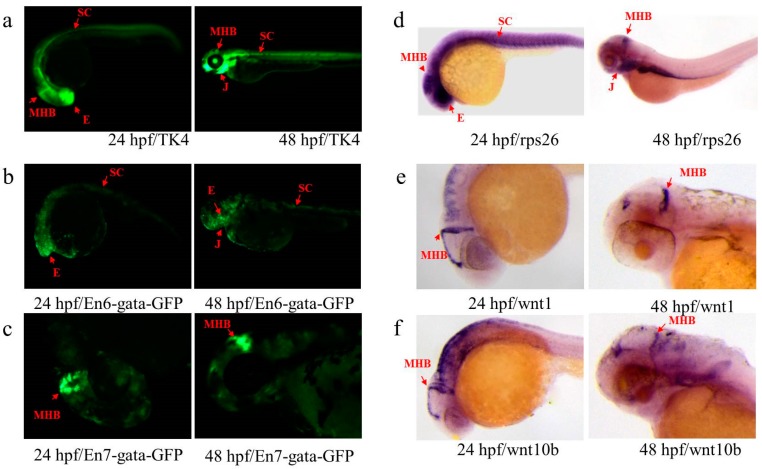
Figure 5.
Expression patterns of En and endogenous rps26, wnt1 and wnt10b in TK4. (a) GFP expression of line TK4 at 24 and 48 hpf; (b,c) GFP expression of the embryos injected with plasmids carrying En6 and En7 at 24 and 48 hpf, respectively; (d–f) gene expression of rps26, wnt1 and wnt10b at 24 and 48 hpf, respectively. Red arrows indicate similar patterns in eye (E), midbrain and hindbrain boundary (MHB), spinal cord (SC) and jaw (J).

