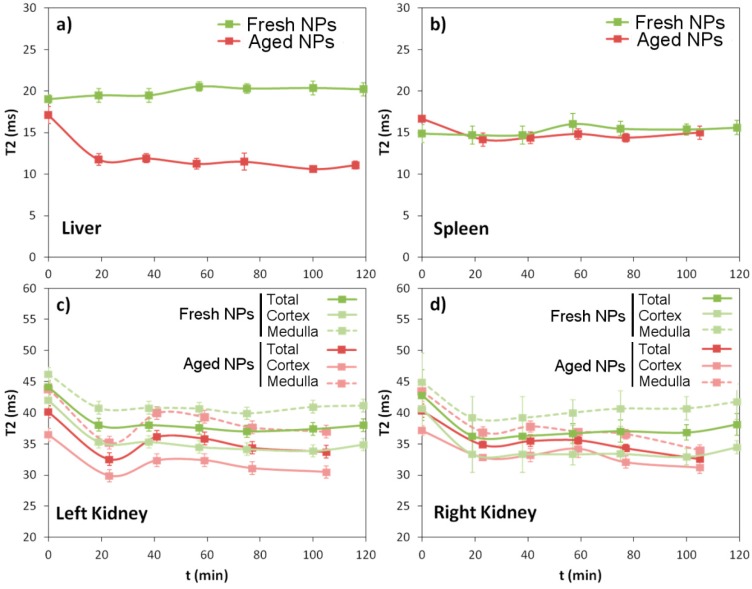
Figure 6.
Evolution of the T2 relaxation times with time for the four different organs analyzed (liver (a), spleen (b), left kidney (c), and right kidney (d)), after the injection of the aged solution, (red) and a freshly prepared solution, (green) of IONPs in two representative animals of each group.

