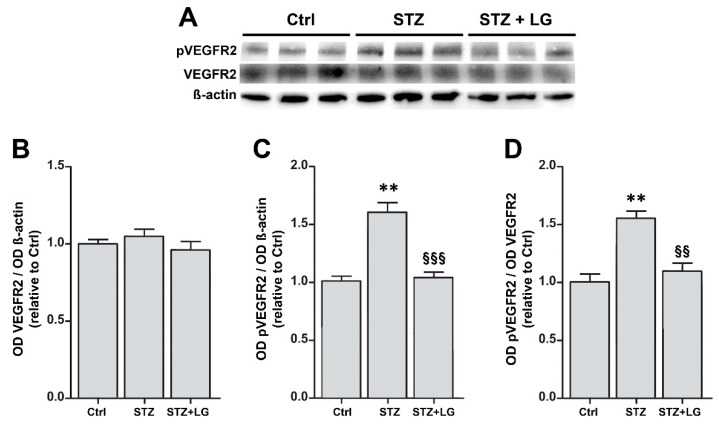
Figure 8.
(A) Western blots showing immunoreactive bands of VEGF receptor 2 (VEGFR2), of phosphoVEGFR2 (pVEGFR2) and of ß-actin, used as an internal standard, in control rat retinas and in retinas of STZ rats with or without LG treatment. (B,C,D) Graphs representing the ODs of the immunoreactive bands to quantify the protein expression of VEGFR2 (B), that of pVEGFR2 (C), and the ratio pVEGFR2/VEGFR2 as a measure of VEGFR2 activation (D). Each column represents mean ± SD. ** p < 0.01 vs. Ctrl; §§ p < 0.01 vs. STZ; §§§ p < 0.001 vs. STZ; n = 3 for all measures. Power value: 0.99.

