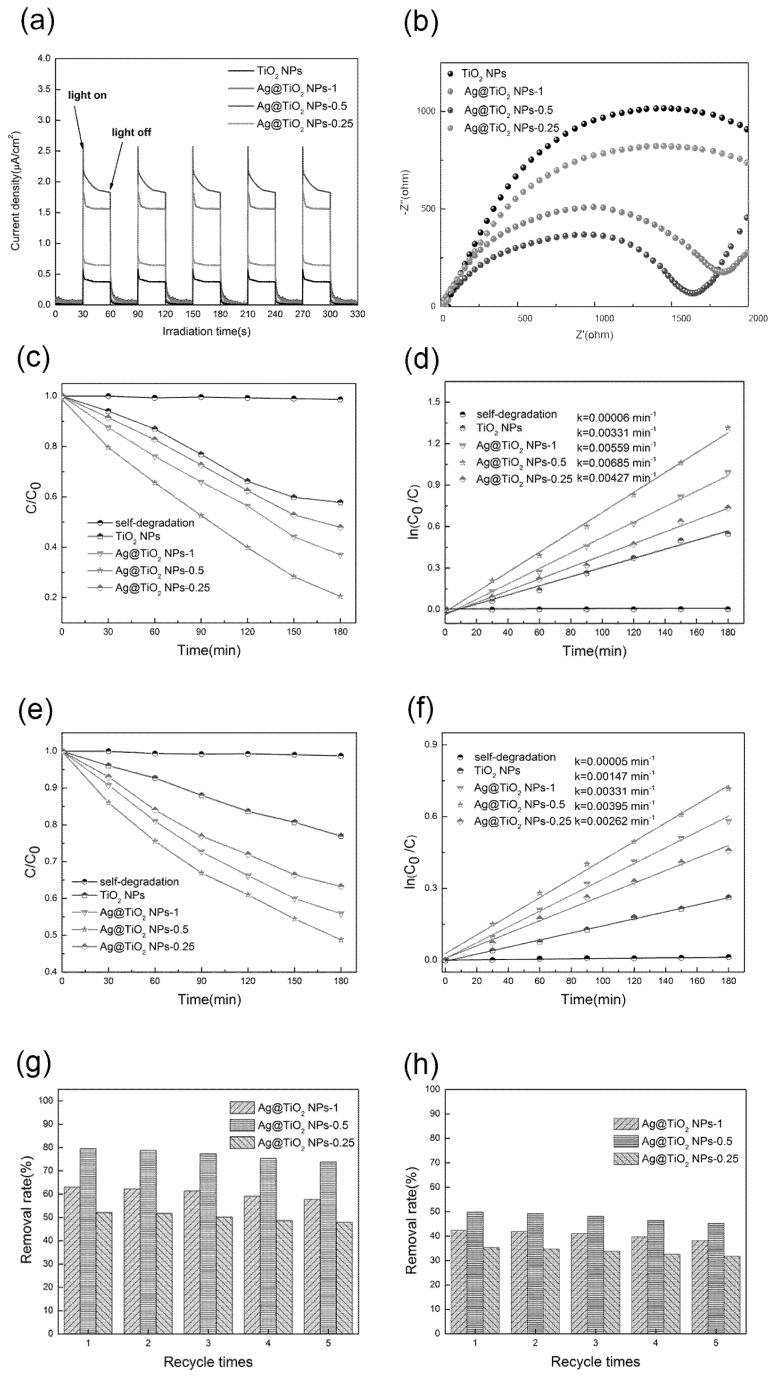
Figure 6.
Photocurrent responses spectroscopy (a) and electrochemical impedance spectroscopy (EIS) (b) of the TiO2 NPs and Ag@TiO2 NPs samples; Methyl Orange (MO) photocatalytic degradation curves of the TiO2 NPs and Ag@TiO2 NPs samples under UV light (c); MO photocatalytic degradation Kinetic fit of the TiO2 NPs and Ag@TiO2 NPs samples under UV light (d); MO photocatalytic degradation curves of the TiO2 NPs and Ag@TiO2 NPs samples under Visible light (e); MO photocatalytic degradation Kinetic fit of the TiO2 NPs and Ag@TiO2 NPs samples under Visible light (f); Cycling performance of Ag@TiO2 NPs samples for MO degradation under UV light (g); Cycling performance of Ag@TiO2 NPs samples for MO degradation under Visible light (h).

