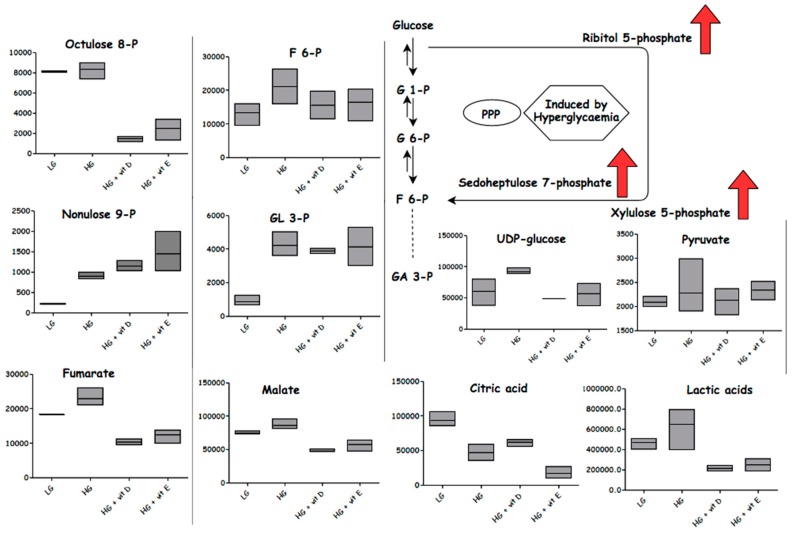
Figure 10.
Metabolites affected by different conditions: normoglycemia (LG), hyperglycemia (HG), with vitamin D or vitamin E. Column figures display the average intensities of specific metabolites in different conditions. G1-P: glucose 6-phosphate; G6-P: glucose 6-phosphate; GA 3-P: 3-phosphoglyceraldehyde; F6-P: fructose 6-phosphate.

