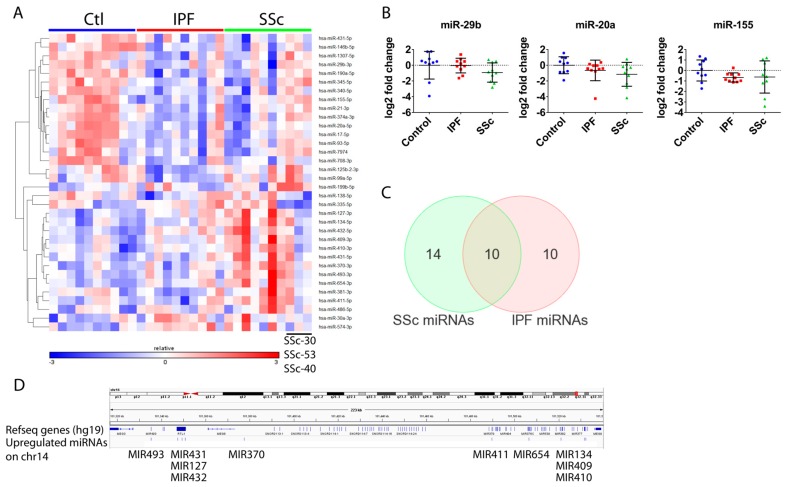
Figure 4.
miRNA-seq identified similar miRNA signatures for IPF and SSc lung fibroblasts. (A) Heatmap depicting differentially expressed miRNAs across all patient group comparisons (fold-change ≥+1.35-fold or ≤−1.35-fold, p < 0.1). (B) miRNA expression analysis using real-time qPCR on the 30 patient fibroblast samples was conducted as described in Materials and Methods for miR-20a, miR-155 and miR-29b in order to demonstrate similar expression changes as observed by miRNA-seq. (C) Venn diagram depicting overlap between miRNAs that were differentially expressed in SSc and IPF fibroblasts. (D) Genome view (hg19) of the Chr14q32 region where a cluster of 10 miRNAs were observed to be upregulated in SSc fibroblasts. Annotated Refseq genes are shown with the location of the indicated upregulated miRNAs marked directly below.

