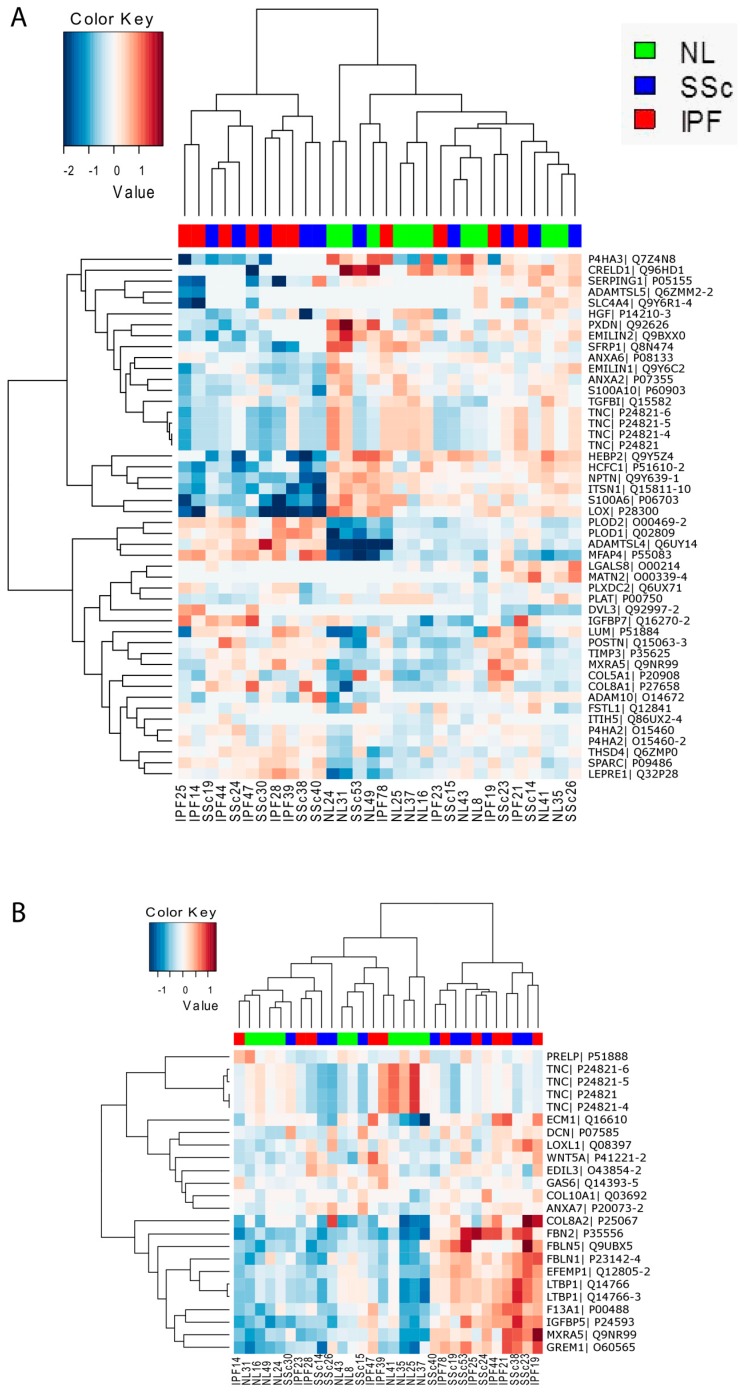
Figure 6.
Hierarchical clustering using differentially expressed matrisome proteins is able to delineate normal-like and disease-like fibroblast groups. Shown are heatmaps of z-scored normalized mass spectrometry protein intensity values of matrisome proteins that were differentially expressed across all patient comparisons (fold-change ≥+1.2-fold or ≤−1.2-fold, p ≤ 0.05) and then clustered. Shown is the data from the soluble fraction (A) and from the insoluble fraction (B).

