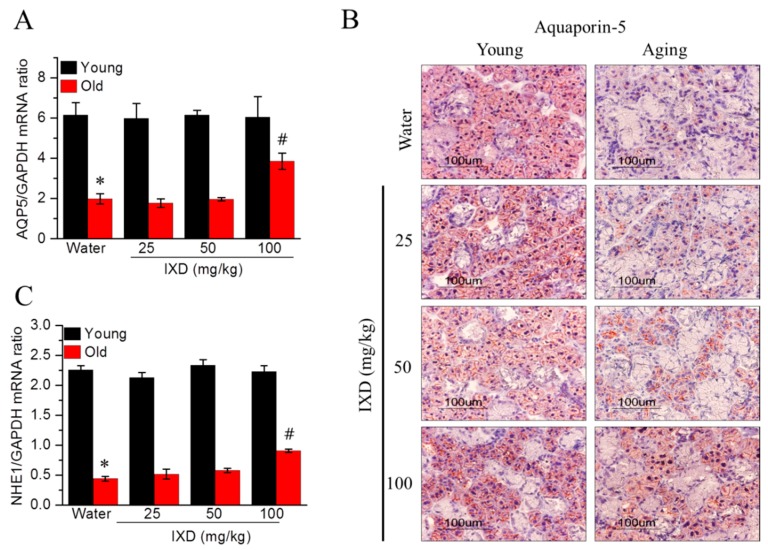
Figure 4.
(A) Aquaporin-5 mRNA expression as evaluated by quantitative real-time PCR; (B) Aquaporin-5 protein expression as identified by immunostaining using the AQP5 antibody. Magnification: 400×, Scale bar: 100 µm; (C) Quantitative real-time PCR was performed to analyze NHE1 mRNA expression. Values are presented as mean ± SEM. * p < 0.05 vs. young control rats, # p < 0.05 vs. old control rats.

