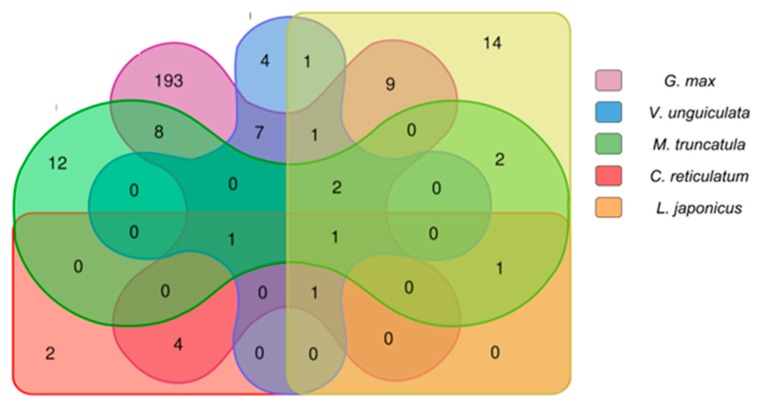
Figure 5.
Count of copaíba lncRNAs aligned to each Fabaceae transcriptome with BLASTN (90% identity): This diagram shows the amount of copaíba lncRNA aligned to the transcriptome of each species, segregated by a color pattern indicated on the legend. In the colored overlapped area are the transcripts which were aligned to more than one species transcriptome, and its respective amount. There are only five species shown in this diagram, for illustration purposes we left out P. vulgaris.

