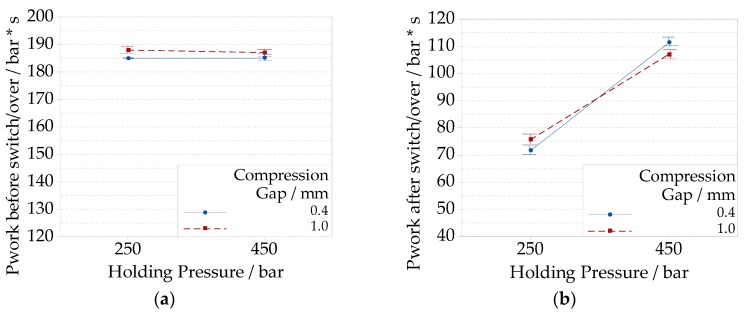
Figure 12.
Interaction plots of the integral of pressure over time for the different compression gap and holding pressure levels: (a) calculated on a time interval that goes from zero to end of filling (before switch/over); (b) calculated on a time interval that goes from the end of injection until end of compression (after switch/over).

