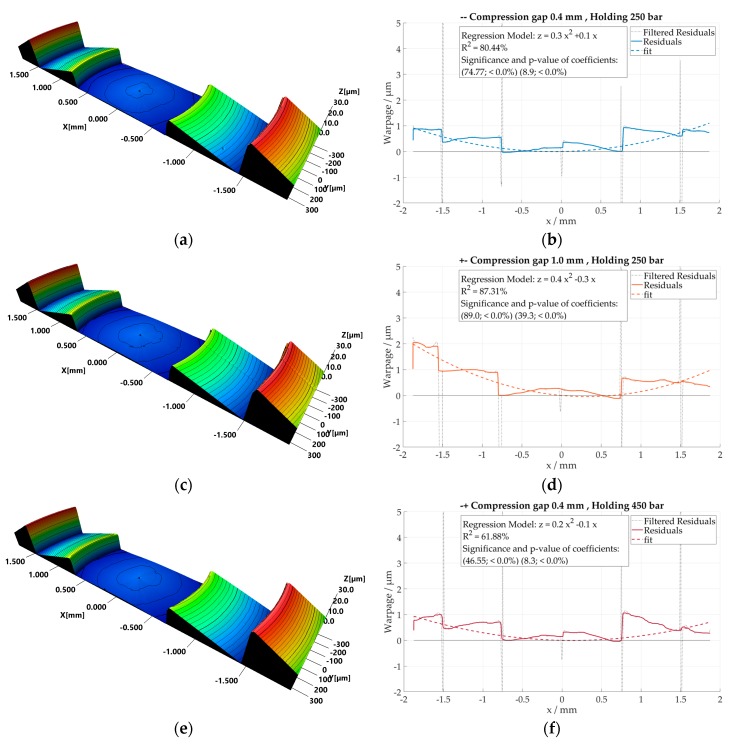
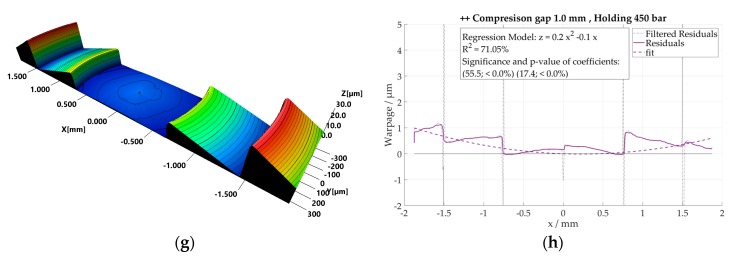
Figure A3.
On the left, 3D view of the lens’ central location sampled as in Figure 5. On the right, the residuals of the respective x profiles in comparison with nominal geometry, sampled in the image center. The following process conditions are considered for COP material results: (a,b) Compression gap 0.4 mm and holding pressure 250 bar; (c,d) Compression gap 1.0 mm and holding pressure 250 bar (e,f) Compression gap 0.4 mm and holding pressure 450 bar; (g,h) Compression gap 1.0 mm and holding pressure 450 bar.


