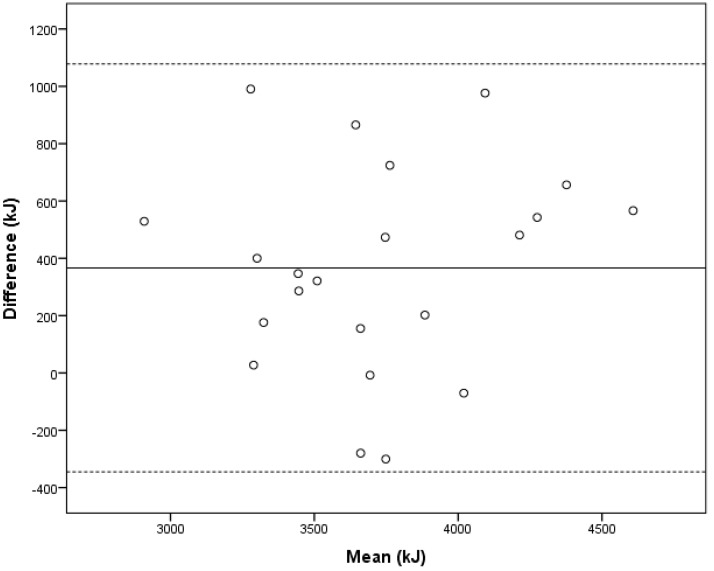
Figure 2.
Bland–Altman plot showing the mean versus the difference in energy intake estimated from food records with active image-assistance and metabolizable energy calculated from doubly labeled water in 22 healthy, 12-month-old infants. The x-axis shows the mean energy intake (EI) per day (kJ) from FR with image-assistance and metabolizable energy. The solid line (-) shows the mean difference of 366 kJ, and the dashed lines (---) show the 95% limits of agreement (±1.96 SD) of 712 kJ.

