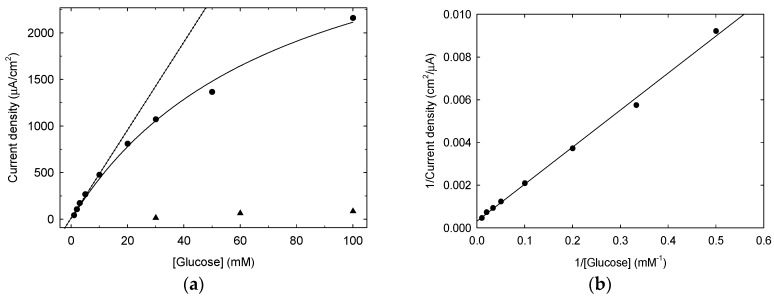
Figure 8.
Panel (a): calibration curves for glucose detection on untreated Pt (triangles) and on phosphate buffer 0.1 M LIFT treated Pt (circles), the straight line interpolates the first 5 points (linear response) while the curved line (Langmuir model of Equation (2)) interpolates the data in the whole concentration range tested. Panel (b): double reciprocal plot of the calibration curve derived from data in panel (a).

