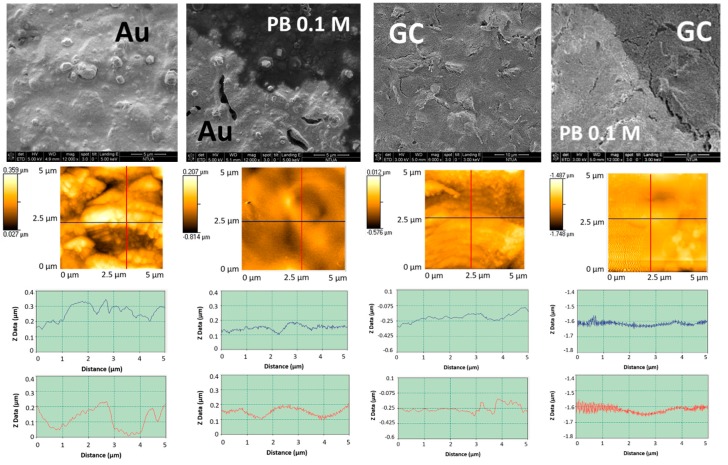
Figure 10.
First row: SEM of Au and glassy carbon (GC) SPEs before and after LIFT treatment with phosphate buffer 0.1 M. Second row: corresponding atomic force microscopy (AFM) topographic images recorded in contact mode; third row: roughness profiles in the two orthogonal directions indicated in the AFM images.

