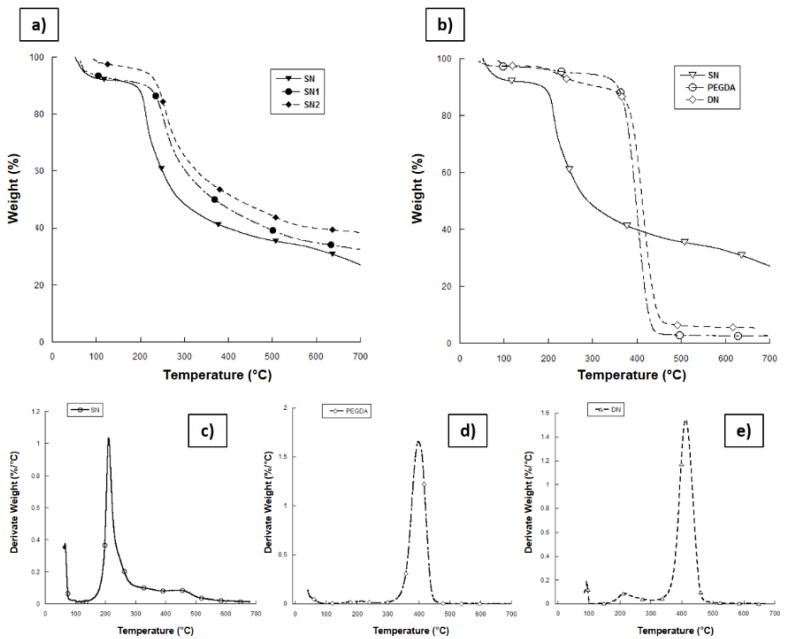
Figure 2.
Results from thermogravimetric analysis (TGA) on lyophilized hydrogel samples. (a) Comparative curves for single network (SN) samples with different amounts of HAp; (b) comparative curves between SN, double network (DN) and poly(ethylene glycol) diacrylate (PEGDA) crosslinked materials; (c–e) derivative mass curves of SN, PEGDA, and DN hydrogels, respectively.

