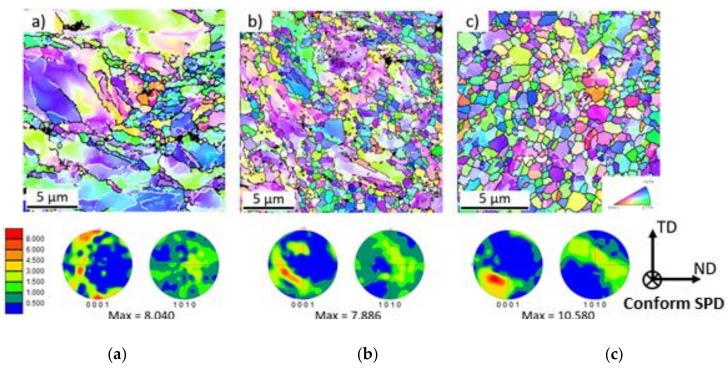
Figure 6.
Cross-section orientation image maps (OIM) and inverse pole figure (IPF) maps for samples after (a) first pass (50 × 50 µm), (b) second pass (20 × 20 µm), and (c) third pass (15 × 15 µm) through Conform SPD. In the figure on the left, the scale of texture intensities is shown as multiples of the random density (m.r.d.) from 0–8.000. The maximum value of each texture is listed below the IPF maps. The orientation triangle for the electron-backscatter diffraction (EBSD) maps is shown in the right-hand corner of the figure.

