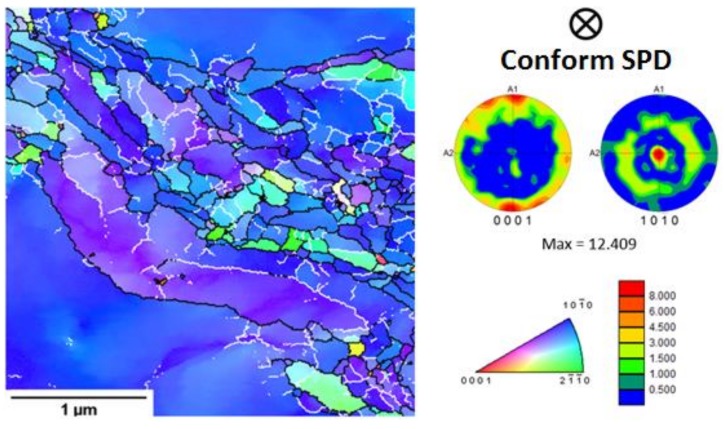
Figure 7.
Transmission EBSD map of the sample after one Conform SPD pass and rotary swaging (3 × 3 µm). High-angle grain boundaries (>15°) are marked by black lines, while the low-angle grain boundaries (between 4° and 15°) are marked by white lines. The texture intensities are carried out as the multiples of random density (m.r.d.) from 0–8.000, with maximum at 12.409 m.r.d.

