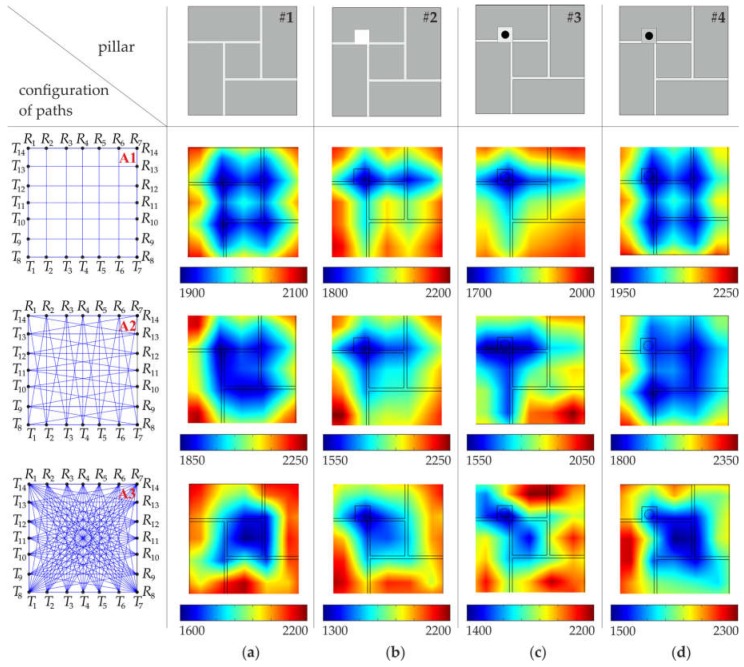
Figure 9.
Tomographic velocity images (values in (m/s)), with a division into 49 pixels (configuration #A), obtained from experimental signals: (a) intact pillar; (b) pillar with the square hole; (c) pillar with the steel bar grouted by means of gypsum mortar; (d) pillar with the steel bar grouted by means of cement mortar.

