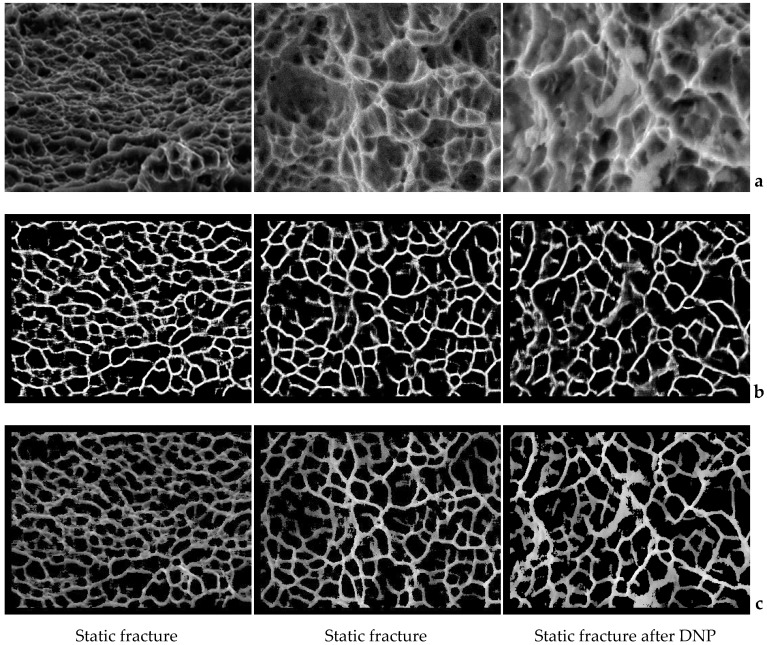
Figure 6.
(a) SEM images of the titanium alloy VT23M (first image) and VT23 (second and third images) [26]; (b) visual representation of the result from the output of the neural network; (c) the result of detecting dimples (black spots), which is imposed on the initial SEM images.

