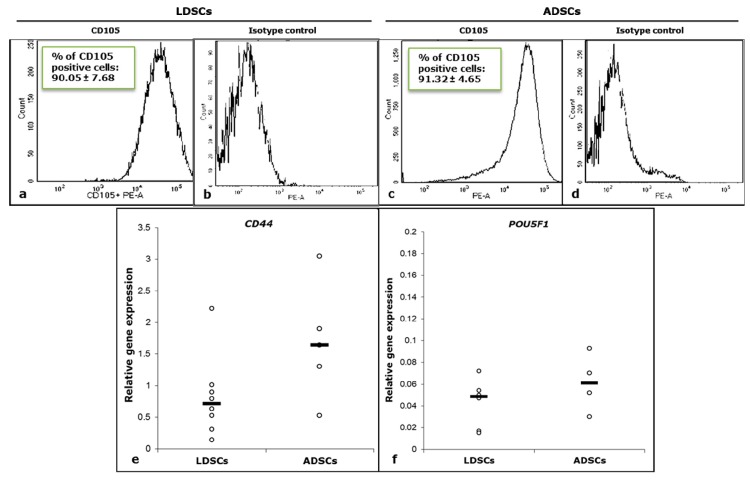
Figure 2.
Flow cytometric analysis of CD105 cell surface marker expression in LDSCs (a) and ADSCs (c) at passage 2 (representative histograms per each group of samples with % of CD105 positive cells presented as mean ± SD, n (LDSCs) = 6 and n (ADSCs) = 4); corresponding isotype controls (b,d); Relative expression of CD44 (e) and POU5F1 (f) genes in LDSCs and ADSCs at passage 2 (day 0 in differentiation assays), normalized to GAPDH, presented as scatterplots with median; sample size for CD44: n (LDSCs) = 8 and n (ADSCs) = 5, for POU5F1: n (LDSCs) = 6 and n (ADSCs) = 4.

